Building a Customer Health Score for E-commerce
Most e-commerce brands find out a customer is leaving when the customer is already gone. Repeat purchase rate slips, subscription cancels tick up, and the monthly report shows the damage three weeks too late. A customer health score flips the timing. Instead of a lagging indicator of who already churned, you get a forward-looking read on who's drifting and how fast.
The mental model that's worked for me is vital signs. A doctor watches blood pressure, heart rate, and temperature to read a patient before symptoms appear. A health score watches behavior signals to read a customer before the cancellation. At Scentbird, we ran versions of this for years; the brands that pulled the biggest retention wins were the ones that treated it as a daily operational tool, not a quarterly slide.
This guide covers how to build one from scratch. The signals that matter, how to weight them, how to tier customers for action, and how to actually use the score to drive proactive retention.
What a customer health score is
A customer health score is a composite metric that represents the strength of a customer's relationship with your brand. It combines behavioral signals into a single number, usually scaled 0-100, that says whether a customer is thriving, drifting, at risk, or already lost.
The score is a snapshot of current engagement based on observable behavior. It correlates with probability of next purchase, but they're not the same thing. A high score means the customer is doing the things that historically precede continued purchasing. A declining score means they're doing the things that historically precede churn.
The point of compressing all of this into one number is operational simplicity. Instead of asking a retention manager to monitor 15 metrics across thousands of customers, you give them one score that points to where attention is needed. The complexity stays in the calculation, where it belongs, not in the daily workflow.
Choosing the right input signals
The score is only as good as the signals feeding it. For e-commerce, these are the categories that matter.
Recency
When did they last interact? Recency is the single most predictive signal of future behavior. The longer a customer goes without a purchase, site visit, or email engagement, the lower the chance they come back.
Measure recency relative to the customer's own purchase cycle, not a flat threshold. A monthly buyer 45 days silent is in trouble. A quarterly buyer 45 days silent is on schedule. Normalizing recency against the customer's expected frequency is what makes the signal actually useful.
Recency signals to track: days since last purchase, days since last site visit, days since last email open or click, days since last support interaction.
Frequency
How often are they engaging? Frequency captures the depth of the relationship. A customer with 8 purchases in 12 months has a meaningfully different relationship than one with 2, even if the most recent purchase date is the same.
Frequency signals: total order count over rolling windows (30, 90, 180, 365 days), site visit frequency, email engagement rate, account login frequency for brands with portals.
For subscription businesses, also track subscription tenure (months active) and any pauses or skips as frequency-adjacent signals.
Monetary value
How much are they spending? Monetary value captures the economic depth. Higher-spending customers are usually more invested, but the more useful signal is the trend. Declining spend from a previously high-value customer is one of the strongest health warnings you'll see.
Track total revenue over rolling windows, AOV trend (rising, stable, falling), product category breadth (are they exploring or repeat-buying the same SKU), and discount dependency (what share of orders use a promo code).
Engagement signals
Beyond purchases, how are they engaging? These soft signals give you early warning before purchase behavior changes.
Engagement signals: email open and click rates over time, SMS engagement for brands using text, social interactions (follows, likes, comments, shares), reviews or UGC submissions, referral activity, loyalty program participation.
A customer who stops opening emails three weeks before they stop purchasing is giving you a three-week head start. Only if you're tracking it.
Support interactions
Support data is the most underused health signal in retention. Track ticket count over recent windows, ticket sentiment (positive, neutral, negative), resolution satisfaction, complaint vs. question ratio, and any open or unresolved issues.
A customer with three negative tickets in the last month is at much higher churn risk than one with zero. Pulling support data into your customer intelligence makes sure those signals make it into the score.
Weighting the signals
Signals don't contribute equally. The right weights depend on your business model, product category, and purchase cycle. A starting framework.
Lead with recency
Recency carries the most weight in most e-commerce health scores, typically 25-35% of the total. The reason is that it's the most time-sensitive. A customer can have great historical frequency and monetary value but still be at risk if they've gone silent recently.
Weight by predictive power
The right way to set weights is empirical. Pull historical data, run a logistic regression or simple correlation between each signal and a binary churn outcome (did they purchase again within X days), and let the data tell you which signals predict churn best in your specific business.
A reasonable starting point: recency at 30%, frequency at 25%, monetary at 15%, engagement at 20%, support at 10%.
Adjust for business model
Subscription businesses should weight subscription-specific signals heavily: skip frequency, pause behavior, tenure. These are direct health indicators in a way they aren't for non-subscription brands.
High-AOV brands with long purchase cycles (luxury, furniture, electronics) should lean on engagement signals over frequency. Purchases are infrequent by nature; engagement between purchases is the better health read.
Consumable brands should weight purchase frequency and recency heavily. The purchase cycle is predictable, and deviations from expected timing are strong churn signals.
Iterate
The first version of your weights is a hypothesis. After 2-3 months of running, validate by checking whether low-health customers actually churn at higher rates than high-health customers. If a 30 and a 70 are churning at similar rates, the weights are wrong and need revisiting.
Tiering customers
A continuous 0-100 score is great for analysis. For action, you need tiers. Three to four tiers gives you the right balance of granularity and operational simplicity.
Healthy (70-100)
Actively engaged, purchasing at or above expected cadence. They don't need intervention, they need reinforcement. Loyalty engagement, early access to new products, referral invites, VIP perks. The principle is to reward healthy behavior rather than take it for granted. Healthy customers are your most valuable segment, and keeping them healthy is dramatically cheaper than recovering at-risk ones.
Stable (50-69)
Moderately engaged, but with some softening. Maybe their purchase interval lengthened, email engagement slipped, or AOV declined. Not in immediate danger, but trending the wrong way.
Re-engagement sequences, personalized recommendations based on purchase history, satisfaction surveys to find friction points, light incentives like free shipping or bonus loyalty points.
At-risk (30-49)
Significant declines across multiple signals. Missed purchases, no email opens, possibly a negative support experience. Without intervention, most at-risk customers churn within 30-60 days.
Direct outreach, ideally a personal email from a founder or retention manager. Win-back offers with meaningful incentive. Feedback requests to understand what went wrong. Alternative engagement paths (social, community, content).
At-risk interventions need to feel personal, not automated. The customer needs to feel like the brand actually cares about their experience, not like they're being mined for one more transaction.
Critical (0-29)
Effectively churned or days from it. No recent purchases, no engagement, possibly an unresolved negative experience. Recovery rates here run 5-15%, so intervention efficiency matters.
One final win-back attempt with a strong offer. A feedback survey (the why is valuable even if they don't return). Suppression from regular marketing to avoid building negative associations. Periodic re-engagement attempts at 90 and 180 days.
Using health scores for proactive outreach
The point of a health score is moving from reactive to proactive retention. Instead of trying to win back customers after they've churned, you intervene while they're still active and the probability of recovery is highest.
Triggered workflows
Set up automated workflows that fire when a customer crosses a tier boundary. Healthy to Stable triggers a re-engagement sequence. Stable to At-Risk triggers a more aggressive intervention. This is what stops customers from slipping through cracks because nobody noticed in time.
Prioritized outreach
For retention managers doing direct outreach, the score is a prioritized list. Instead of randomly picking customers for a check-in, focus on high-value customers whose scores have recently declined. Those are the ones where intervention has the highest expected value: worth a lot, at risk of leaving.
Segment-specific campaigns
Tier becomes a segmentation criterion. Healthy customers get reinforcement and upsell messaging; at-risk customers get re-engagement and win-back. This avoids the common mistake of sending the same message to customers in completely different states.
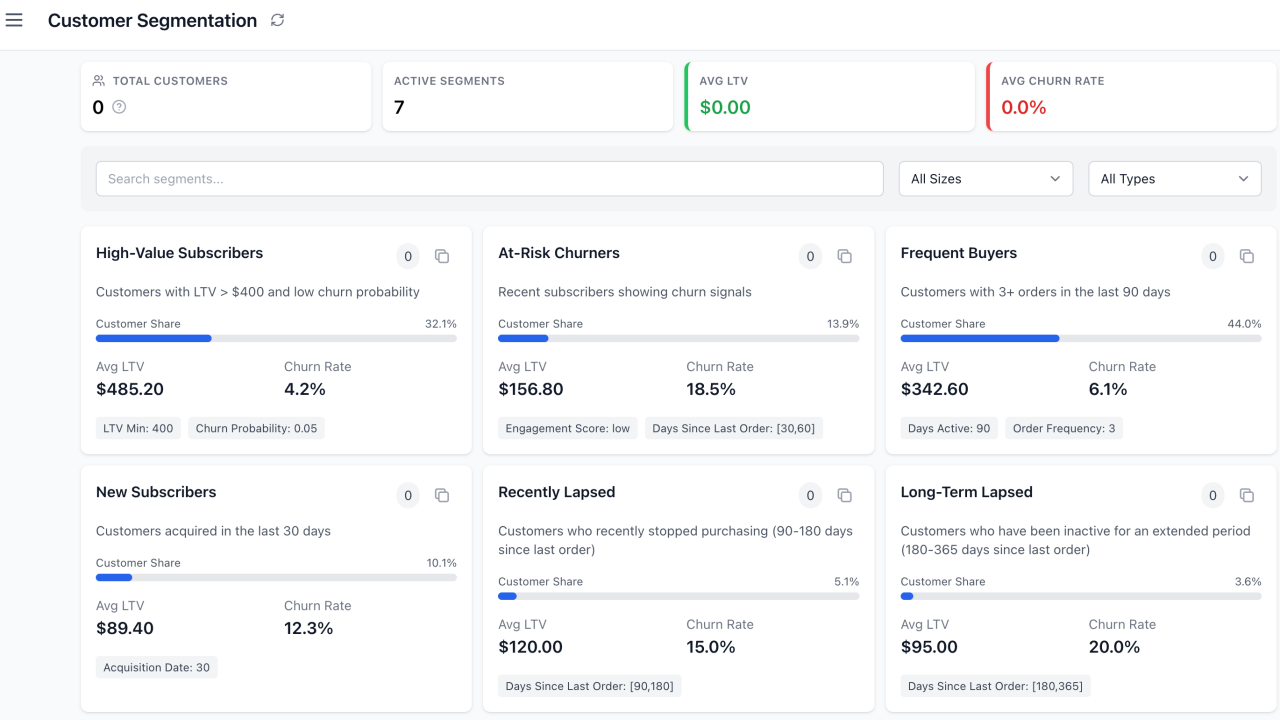
Platforms with smart segmentation let you combine tiers with other attributes ("high-value, at-risk subscription customers" or "recently acquired, rapidly declining health score") for sharper targeting.
Going deeper
A health score is a starting point. The most effective retention programs combine it with deeper analytics to understand why customers are healthy or at risk and what specifically is most likely to work.
Root cause
When a score declines, the question is why. Drilling into the components shows the actual behavior change. Did they stop opening emails. Did they have a negative support experience. Did purchase frequency slip. Each root cause points to a different intervention.
Predictive modeling
Current-behavior scores can be enhanced with predictive models that forecast where the score is heading. A customer at 75 today whose trajectory points to 45 in 30 days is more urgent than one at 65 and stable. Retention intelligence platforms combine the current snapshot with the trajectory to identify at-risk customers earlier.
LTV integration
Combining the score with an LTV estimate gives you a two-dimensional view: how much is this customer worth, and how likely are they to stick around. The matrix tells you where to spend retention resources for the highest expected return: high-value customers at risk of churning.
Where to start
Building a health score doesn't require a data infrastructure project. Start with what you already have (purchase history, email engagement, support tickets) and build a weighted score in a spreadsheet or basic SQL. Define three or four tiers and start using them to guide outreach.
Then measure. Do customers who get tier-based intervention retain better than a control group. Use the answer to refine signal weights and tier thresholds. Add more signals over time (site behavior, loyalty data, social engagement) and validate empirically as you go. The goal is continuous improvement, not perfection on day one.
A health score that's actually used turns retention from a calendar-driven activity into a system that catches problems early. That shift alone has been worth millions in preserved LTV at the brands I've watched implement it well. (This is a big part of what we build at Finsi.)
Frequently asked questions
What is a customer health score?
A composite metric, usually 0-100, that combines behavioral signals like purchase recency, order frequency, email engagement, and support interactions into one number representing the strength of the customer relationship. It's an early warning system for churn that lets retention teams prioritize outreach before a customer cancels. Unlike standalone metrics, the score is a holistic, forward-looking read.
How do I build a customer health score from scratch?
Start with the data you already have: purchase history, email engagement, support tickets. Assign weights to each signal category (a common starting point is recency 30%, frequency 25%, engagement 20%, monetary 15%, support 10%). Normalize each signal, multiply by weight, sum to a score. Define 3-4 tier thresholds (Healthy, Stable, At-Risk, Critical) and validate by checking whether low-scoring customers actually churn faster over the next 60-90 days. A spreadsheet works to start; graduate to a platform like Finsi's retention intelligence as the customer base grows.
What signals should I include in a health score?
Five categories: recency (days since last purchase, last site visit), frequency (order count and email engagement over rolling windows), monetary value (total spend and AOV trends), engagement (email opens, SMS clicks, loyalty activity, social interactions), and support (ticket volume, sentiment, resolution satisfaction). Normalize each signal against the customer's own baseline. A quarterly buyer who misses one cycle is more concerning than a first-time buyer 30 days post-purchase. See the guide on customer segmentation strategies for more on signal selection.
How should I act on customer health scores?
Map each tier to a playbook. Healthy customers (70-100) get loyalty reinforcement, VIP perks, and referral invites, not discounts. Stable (50-69) gets re-engagement sequences and personalized recommendations. At-Risk (30-49) needs direct outreach and meaningful win-back offers. Critical (0-29) gets one final recovery attempt and a feedback survey. The biggest impact comes from automated workflows that trigger on tier changes, combined with smart segmentation. Start a free retention audit to see your current tier distribution.
What tools can I use for customer health scoring?
You can build a basic score in SQL or spreadsheets, but it stops scaling at a few thousand customers and demands manual updates. Dedicated platforms automate the calculation, update in real time, and integrate with marketing and CRM tools to trigger tier-based workflows. Finsi combines health scoring with predictive churn modeling, RFM segmentation, and AI-powered recommendations, so you get both the score and the action for each segment. For growth teams and founders running retention alongside acquisition, an automated system removes the manual overhead and makes sure no at-risk customer slips through.
Stop guessing. Start knowing.
Finsi connects your e-commerce data, tells you what to do, and executes it — email campaigns, ad optimization, retention flows. Free 30-day trial.
Start Free Trial